It Takes a Village: How to Become a Good Grid Community Certified Partner
February 22, 2019
Come Together: The Importance of Collaboration in Providing Social Services
March 1, 2019For those involved in public service, the work constitutes more than “just a job”. They are not there to fill a spot on their resume, or to prove something to someone else. People get involved in this field because they are passionate for helping others and want to positively affect their communities. Whether it’s ending homelessness, stopping family violence, ensuring that children are supported and cared for, or a multitude of other causes, social impact workers do what they do to positively affect the lives of others.
The danger has always been, however, that a large amount of people who need services will fall through the cracks. This unfortunate aspect of large-scale social work is often due to an inability to keep track of a large and always changing population of individuals. Big questions arise such as: How do I know I’m maximizing the amount of people I’m helping find services? How do I know they’re receiving those services? How do I measure their progress?
The Good Grid can help you answer these questions by using its tools to track and analyze your organization and client data by keeping up with and examining data sets.
Utilizing Data Analysis in Providing Services
In today’s society we obviously place high value on data to determine how we run our lives. From checking how many views or shares we have on Facebook to filing tax information with the Internal Revenue Service (IRS) most of our lives are consumed by data analytics, often without us realizing it.
So why, one might ask, wouldn’t we utilize data analytics to measure the success of providing services to those that need them?
According to the American Academy of Social Work and Social Welfare, “data from computerized social service programs… can help to illuminate social problems and propel effective solutions. Technological innovations have made it possible to manage and analyze such digital assets in real time.”
Given that part of our mission here at The Good Grid is to ensure clients in need do not fall through the cracks, one of our greatest assets is creating and compiling data sets from your organization’s data input and collection to recognize patterns, draw conclusions, and adapt our practices and actions based on those conclusions.

How Organizations Can Utilize Good Grid Data to Accomplish Their Goals
The Good Grid can help organizations utilize data to get a clear picture of who needs help and access to resources. There are a number of different ways organizations can utilize the Good Grid to analyze this data to help their clients.
Utilizing client information to notice patterns in service providing.
The Good Grid collates basic client demographic information in order to paint a picture detailing who needs services and how best to make sure they’re provided. Information such as racial or ethnic background, age, family size or marital status, location, or employment status, provide a window into understanding what populations of people need services and, most importantly, who aren’t getting the services they need. For example, if services are failing to reach one or more specific sectors of a city over others, we would then want to find out why that is and what can be done to curb that trend.

Keeping up with client as well as caseworker assignment progress.
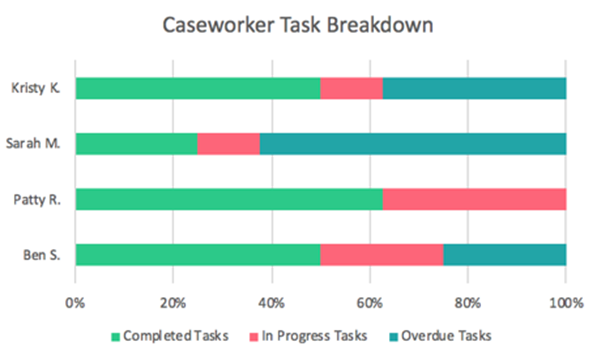
Caseworkers utilizing the Good Grid’s Find Good system can actively assign actions for their clients to complete. This can be completing a resume, submitting timesheets, applying for bus passes, or any other action that the caseworker believes will aid the client. This allows the caseworker to ensure that clients are fulfilling their obligations to themselves and making adequate progress. This system also provides a way caseworkers can help organizations to run reports on their own effectiveness. For example, if one organization or service provider is rejecting client applications more than others, they would want to know why that is and what can be done to maximize the amount of clients getting the services they need.

Track client demographics through the use of graphs.
Whenever possible, it’s always beneficial to be able to see data in graph format. This enables the user to easily see what “the message” in the data is. The Good Grid creates visually appealing and easy-to-read graphs to help you visualize your client reach and program efficiency, and then makes decisions regarding how to reach more clients of differing backgrounds.

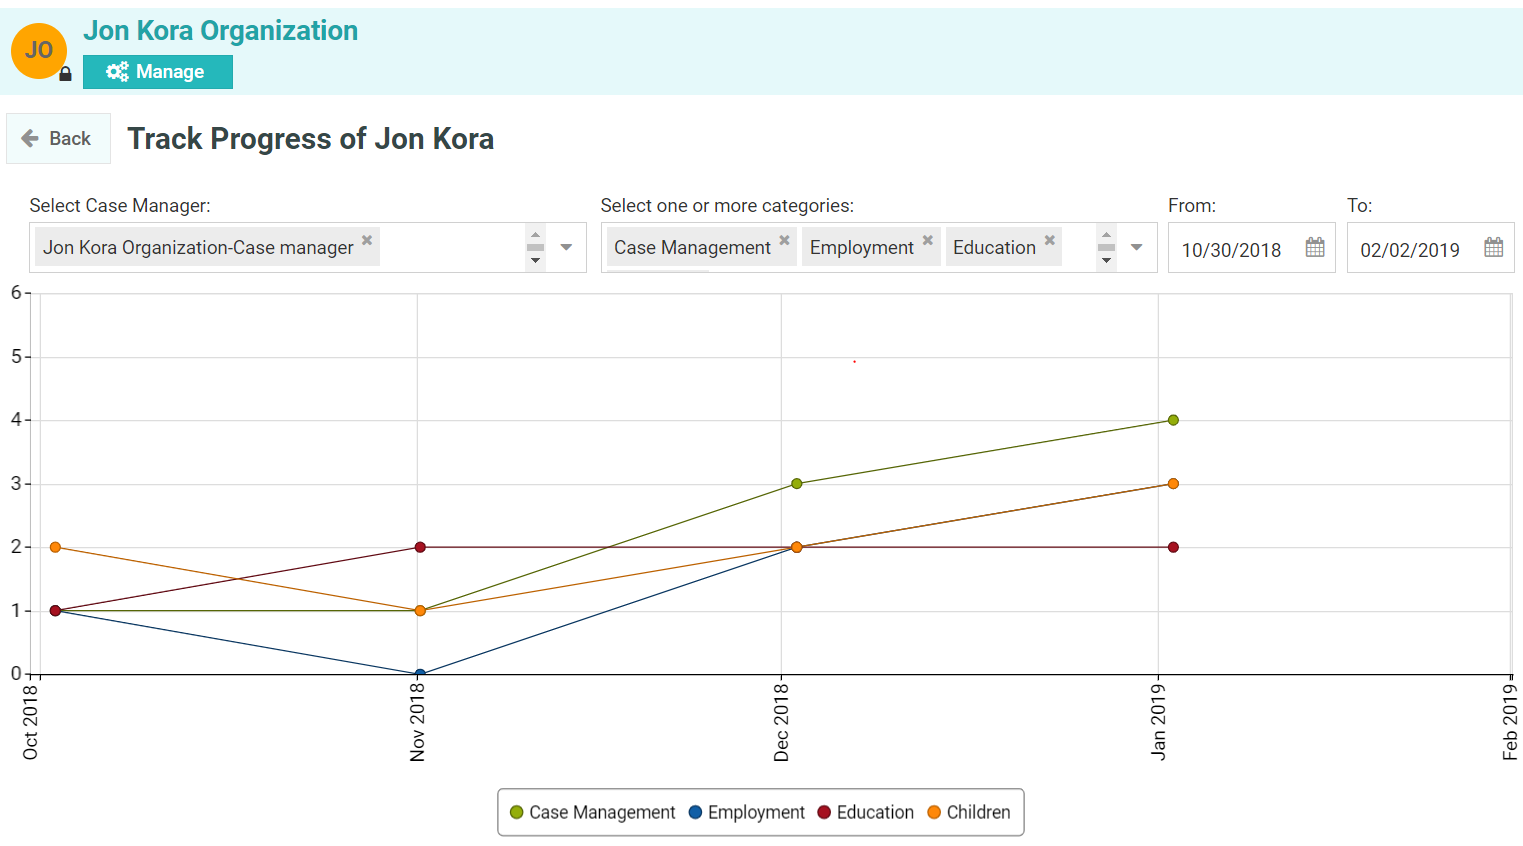
Evaluation Matrix helps you to measure the success of your clients.
The Client Evaluation Matrix serves as a tool for evaluating how successful a client has been on a regular basis. This graphing tool, much like a stock market ticker, illustrates the ups and downs a client may experience during their time seeking services. Our tool also allows you to measure a client’s progress against the aggregate. This provides a clearer picture as to how much your clients have progressed across a multitude of avenues including employment, housing, child support, etc.

We live in an era where technology has become fully integrated with almost every aspect of our lives. In utilizing technology to help service providers connect with and help clients, The Good Grid will continue to strive to better know and serve our community at large.

For more information on The Good Grid, please visit our website here.


